External Plant Modeling
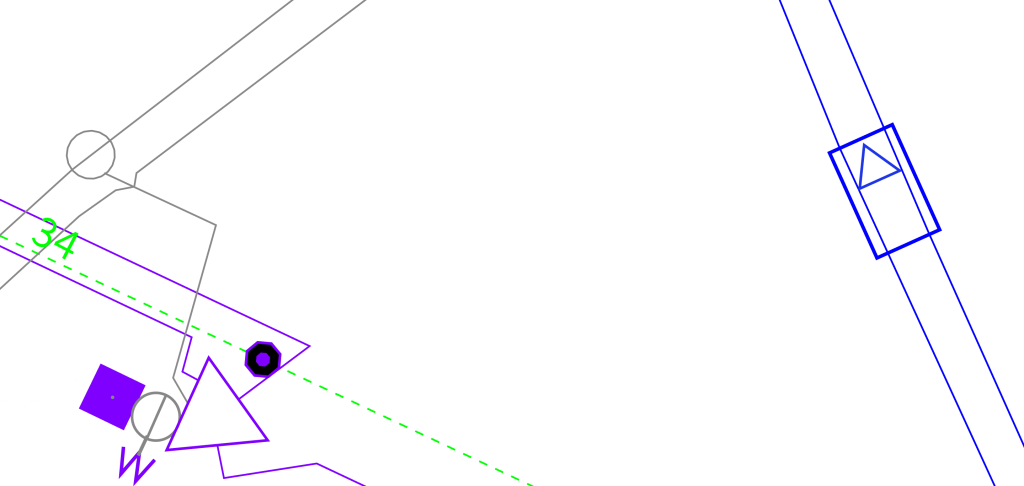
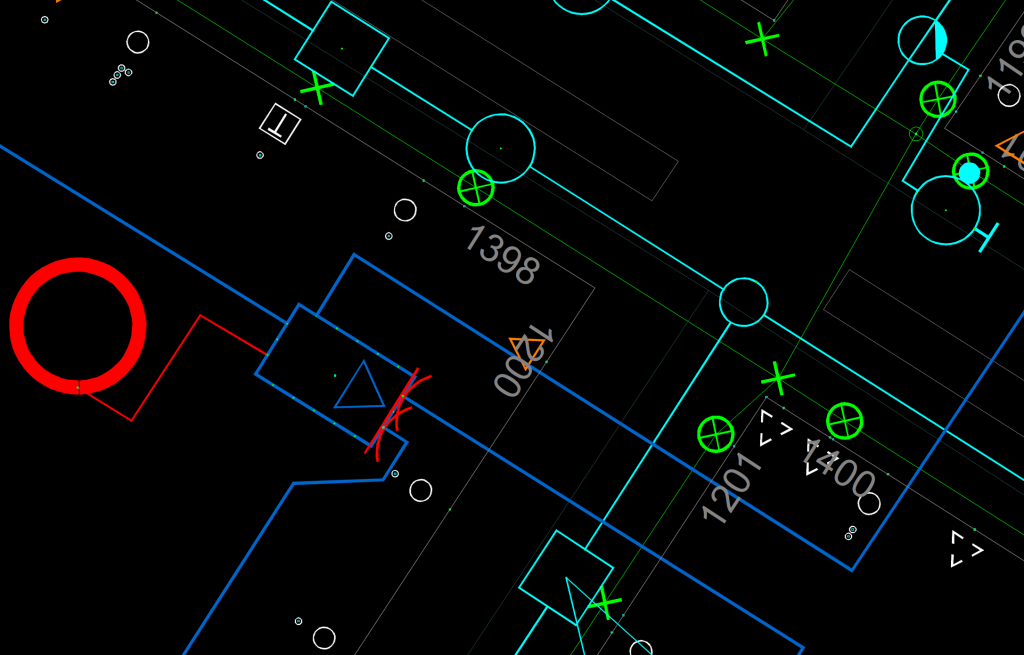
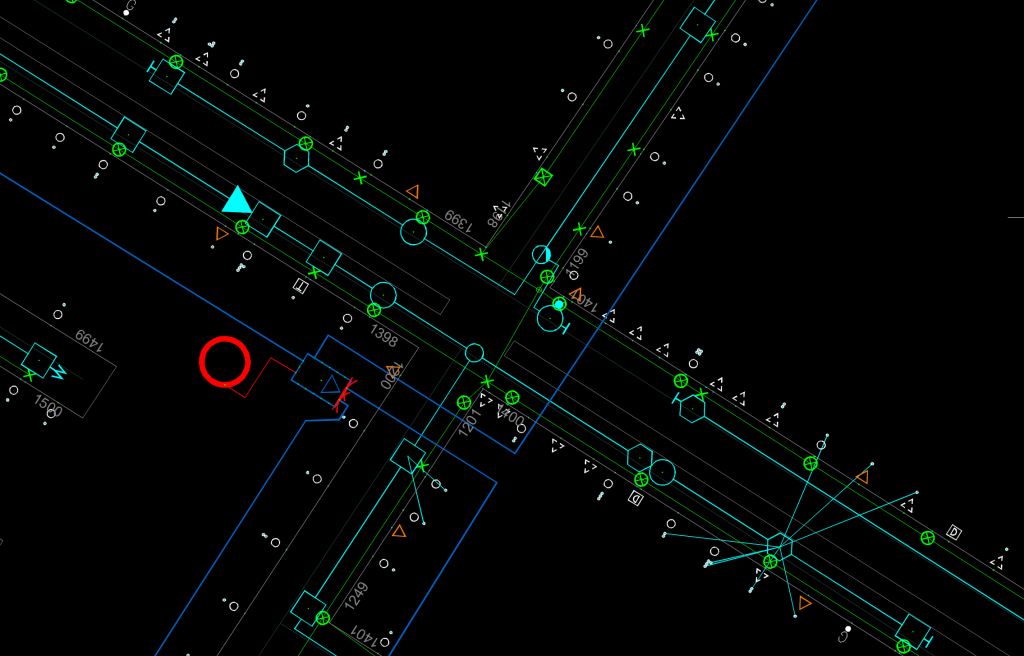
Our solution integrates with AutoCAD MAP, a widely recognized tool in the engineering and technical drawing industry. This minimizes training times and reduces network drawing costs.
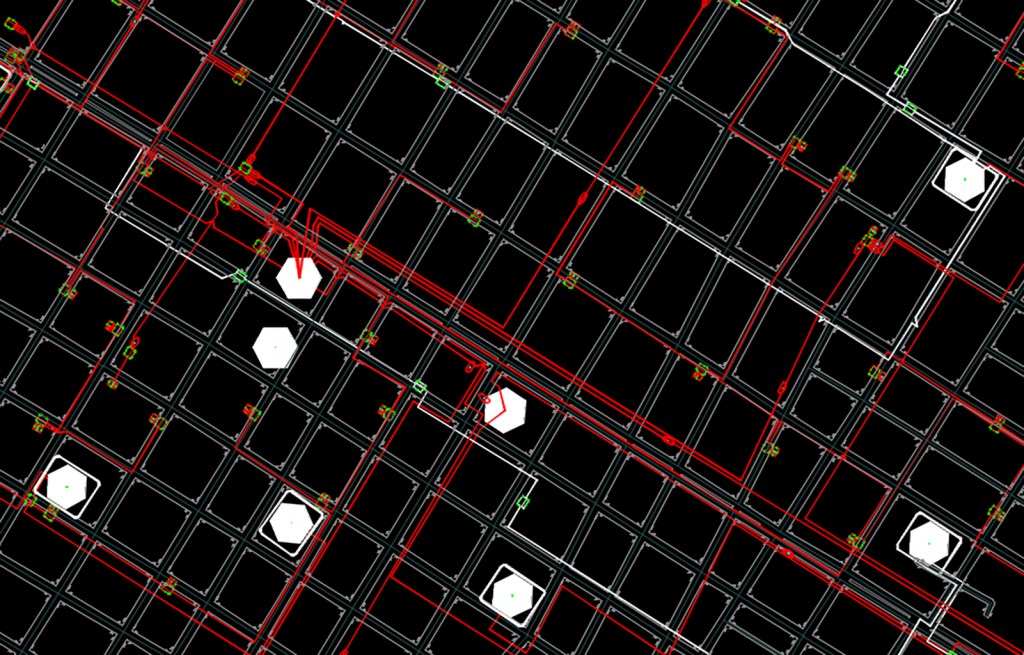
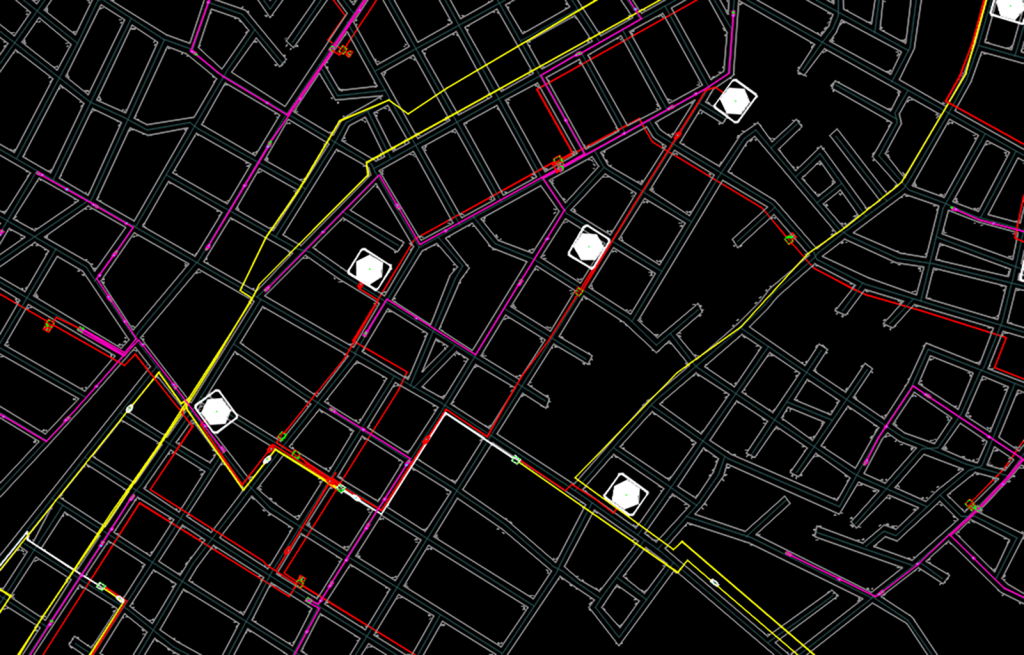
Symbolization is configurable based on the data associated with each object, the user's area of responsibility, and the zoom level at which the model is being viewed, providing great flexibility and customization in data visualization on the platform, even when all users are using the same network model.
Permissions for each user can be defined by network type, geographical area, system module, command, or associated data type. Every modification made to the model is saved according to who performed it, from which workstation it was executed, and the exact time.
It allows analyzing the network model at any date and time, enabling the understanding of its exact connectivity status at the moment of any necessary event. It also allows tracking the locations of investments made in the last year, following a specific asset over time, and even analyzing how customer connections were in a specific area after a technology change in the network.
Each update is entered with the date and time it occurred on-site. Certa GIS performs temporal validations and ensures the associated data required to ensure that different areas update the network model consistently with the information linked to it, coming from other systems within the company, such as CRM, billing, ERP, or monitoring systems, among others.
Allows editing and viewing the network model in multiple ways, whether geographical or schematic. An object can be represented in more than one visualization without being duplicated in the model.
It has the ability to edit the internal components of complex objects, even in extreme cases such as electrical substations or communication hubs, which is an advanced feature that can be highly beneficial in network management and planning.
It allows visualizing both the network's design topology as designed by engineering departments, as well as the actual street topology resulting from network operations and failures in the same model, and comparing them. This ensures that the network in the street remains as close as possible to the original design, to guarantee efficiency, reliability, and network performance.
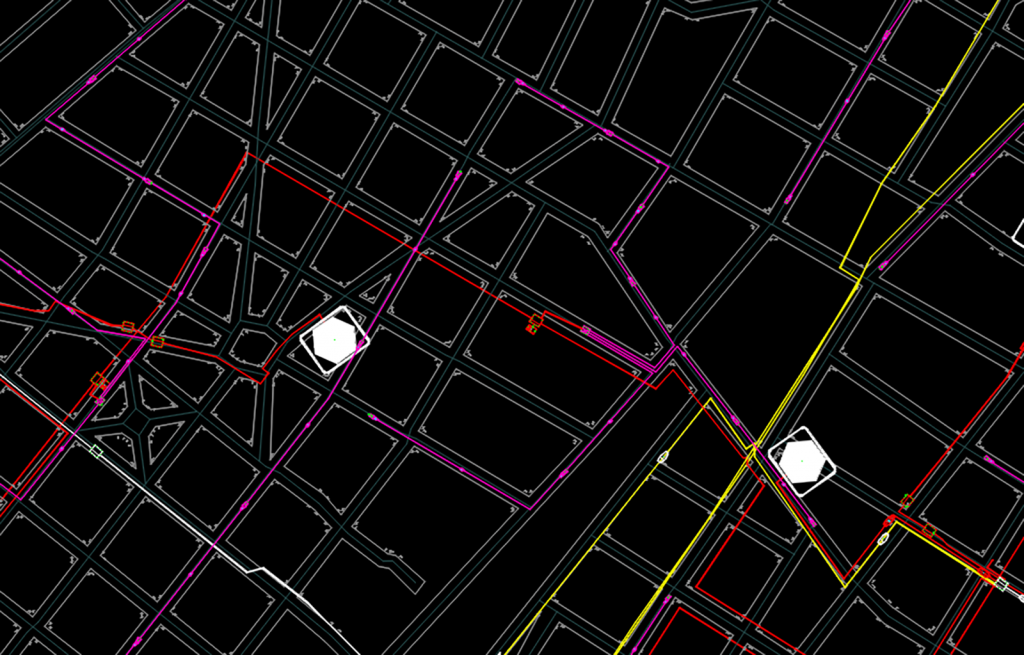
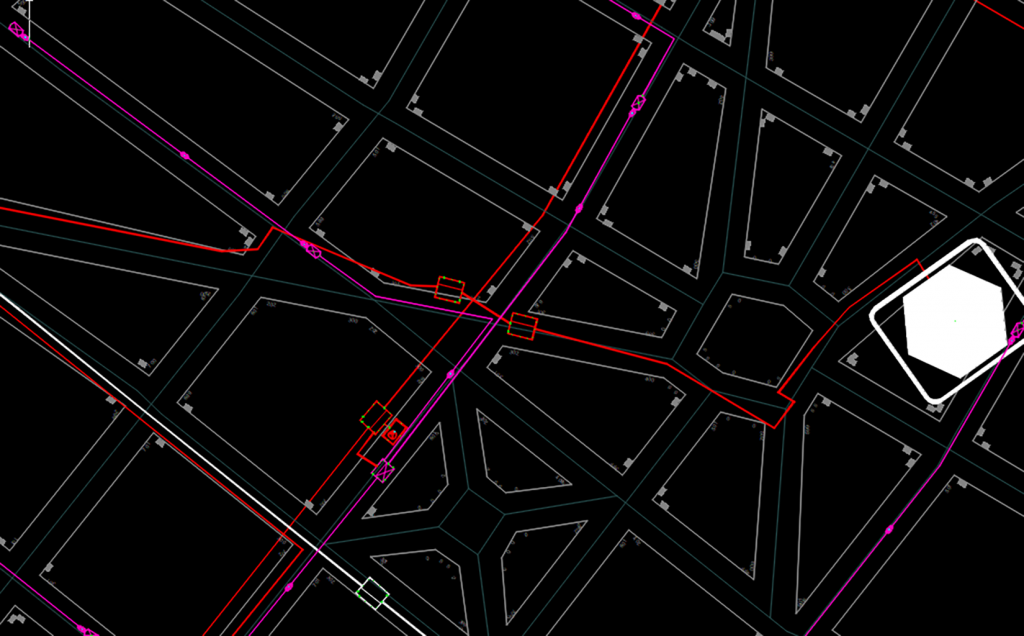
When analyzing corporate data, it's possible to perform various analyses on the geographic or schematic model of corporate data coming from other systems, totaling values by area or circuit, generating reports, or spectacular thematic maps that are very easy to understand. These are essential for identifying patterns and trends.
It allows managing topologies by phase in electrical networks, by fiber in fiber optic networks, or by pair in copper networks, which are fundamental for accurate and effective representation of different types of network infrastructures.